
Deal Analysis
Maximize deal profitability with tools that work with you
A quick tour of Analysis tools
Excel and external tools are clunky for visualizing and optimizing the numbers for deals.
Let’s do something about that:
Visualize what you care about
Trend Analysis

One of the eight graph modes, seen with some calculations
Setting up graphs in Excel feels like you’re wrestling with the program. The result is many teams compromise on how their data is visualized and are stuck with fewer, less detailed graphs than ideal.
The Trend Analysis section gives you an easy-to-use playground to visualize the rent roll and T-12 data however you need.
We grab the data directly from Document Processing and give you eight different graph modes to work with. Some examples:
See the breakout of Other Income line items graphed against each other.
Visualize rent roll and T-12 categories against each other.
See the relation of market and actual rent across time by dividing actual by market. Then add a trendline for the total rent in the same graph. (This can all be done in under 10 clicks).
And many, many more options!
Each graph also has an accompanying table.
These graphs and tables can then be exported to Excel, downloaded as an image or PDF, or used directly in the Presentation Builder.
Manage what values go into your model
Override Tables
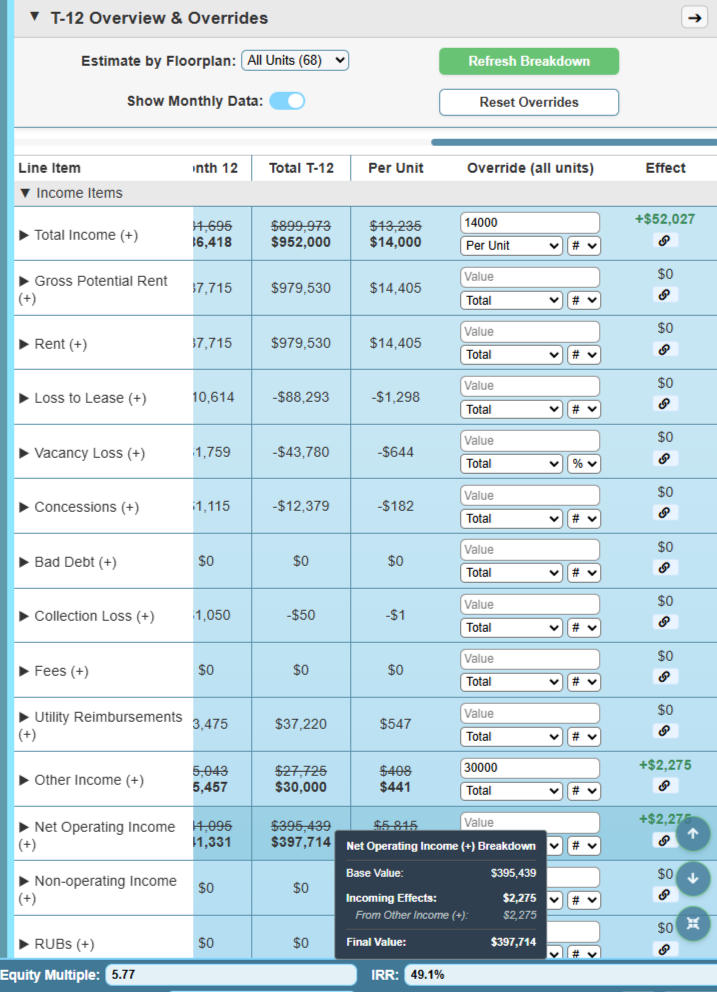
Part of the T-12 Override Table, with an example of Other Income changes flowing to NOI
Excel does a great job handling calculations, but it looks like…Excel. It also only shows one state at a time, so it’s hard to see the effects of changes without having a huge model.
Our Override Tables fill this role, both visually and functionally. You can see a summary of your rent roll and T-12 in a nicer format, and see the effects of any desired overrides.
For each specific floorplan and T-12 category, there are 4 options for overrides and we show you the effect in the table, letting you be more exact when playing with assumptions.
The Trend Analysis graphs and tables can also use these override values.
Choose the best investment approach, intelligently
Scenario Snapshots
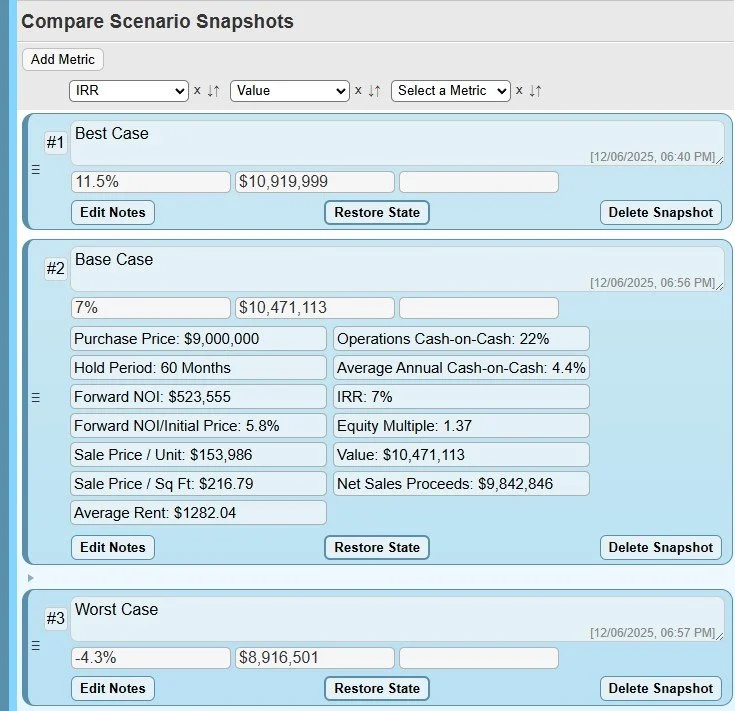
Snapshots of the same deal with three different sets of assumptions
One of the main issues with Excel is that you can only see one version of things at a time. If you need to play with the numbers and different investment approaches, the process is very crude, with tweaking numbers, remembering the effect, and repeating over and over.
Scenario Snapshots now make playing with the numbers a structured, intelligent task. The new process:
Make all needed changes for one setup
Capture a Snapshot in one click
Repeat
Compare all Snapshots against each other, sorting by metrics you choose
Restore the preferred option with a single button
The result is you can now compare completely different deal structures with ease, and restoration of your chosen one one is handled for you, you don’t need to remember the specifics.
Our Templates feature also pairs nicely with this, letting you quickly switch large numbers of inputs, which can then be snapshot, and the effects compared.
Sensitivity Analysis and Goal Seek done better
Analysis Tools

A standard Two-Variable table of Price against Period, using IRR
When it comes time to optimize the details of your deal, sensitivity tables and goal seek can be invaluable. The issue is Excel’s data tables are technical to setup and greatly slow down your system, and goal seek is very manual and simplistic.
We addressed all these issues with our own One- and Two-Variable Sensitivity Tables, and Goal Seek. Setup is simple and there’s minimal performance impact. Other benefits include:
The two-variable sensitivity matrix is heat mapped and interactive, letting you change the inputs' values by simply clicking the result values.
The one-variable analysis has a graph and it’s results are also interactive.
For Goal Seek, they only need to be setup once, it also shows you the previous value, the delta, and provide an undo button.
Sensitivity visuals can also be exported to Excel, as an image or a PDF.
Summary: Deal Analysis
The Problem
Underwriting properties responsibly can’t be done in a cookie-cutter manner. Someone with experience needs to play with the numbers and work to understand the data of a deal.
Excel does a good job at handling mass calculations, but extending your model is so intensive that most settle with good-enough. This especially applies to visuals and tools that assist with analyzing the data, with most people having fewer graphs and analysis assistance than ideal.
What you need
To fully understand the potential of a property to ensure you don’t skip diamonds in the rough and to get the most out of any deals you do pursue.
Our Solution
To provide you with tools that cover many of the aspects of deal analysis so you can dig deeper, much faster and with more accuracy than before:
Trend Analysis graphs and tables make it easy to visualize just about anything related to the rent roll and T-12.
Snapshots make it possible to compare any deal structures you want.
Overview tables assist with review and handling overrides
Two- and One- Variable analysis readily forecasts adjacent scenarios
Goal Seek makes it easy to optimize for specific output metrics